DX12: FCAT Frame Experience Analysis FCAT Frame Experience Analysis Hitman 2016
With a benchmark technology called FCAT on the following few pages, we will look into Frame Experience Analysis. With the charts shown we are trying to show you graphics anomalies like stutters and glitches in a plotted chart. Lately there has been a new measurement introduced, latency measurement. Basically it is the opposite of FPS.
- FPS mostly measures performance, the number of frames rendered per passing second.
- Frametime AKA Frame Experience recordings mostly measures and exposes anomalies - here we look at how long it takes to render one frame. Measure that chronologically and you can see anomalies like peaks and dips in a plotted chart, indicating something could be off.
| Frame time in milliseconds |
FPS |
| 8.3 | 120 |
| 15 | 66 |
| 20 | 50 |
| 25 | 40 |
| 30 | 33 |
| 50 | 20 |
| 70 | 14 |
We have a detailed article (read here) on the new FCAT methodology used, and it also explains why we do not use FRAPS anymore.
Frametime - Basically the time it takes to render one frame can be monitored and tagged with a number, this is latency. One frame can take, say, 17 ms. Higher latency can indicate a slow frame-rate, and weird latency spikes indicate a stutter, jitter, twitches; basically anomalies that are visible on your monitor.
What Do These Measurements Show?
Basically, what these measurements show are anomalies like small glitches and stutters that you can sometimes (and please do read that well, sometimes) see on-screen. Below, I'd like to run through a couple of titles with you. Keep in mind that average FPS matters more than frametime measurements.
Hitman 2016 Frame Experience Analysis
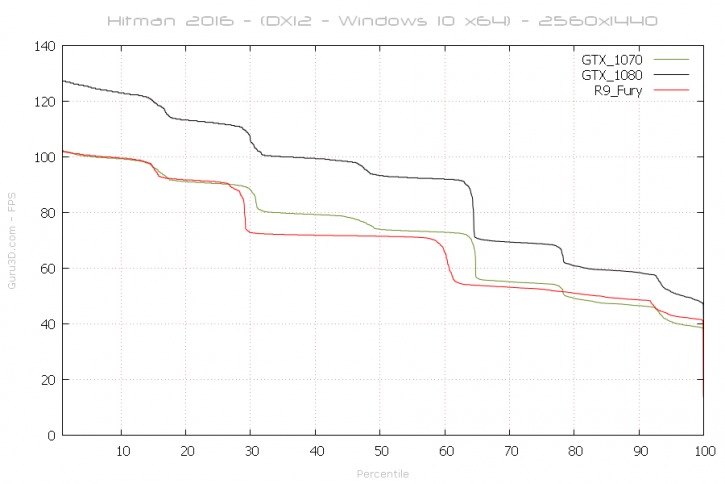
Above, the percentile chart of the 31 seconds gaming @ 2560x1440, this is the intro run of the integrated benchmark. Here we plot FPS and place it in relation to percentiles.
- In green, GTX 1070 - 50% of the time measured frames is doing roughly 70 FPS, so that is the average framerate (higher = better).
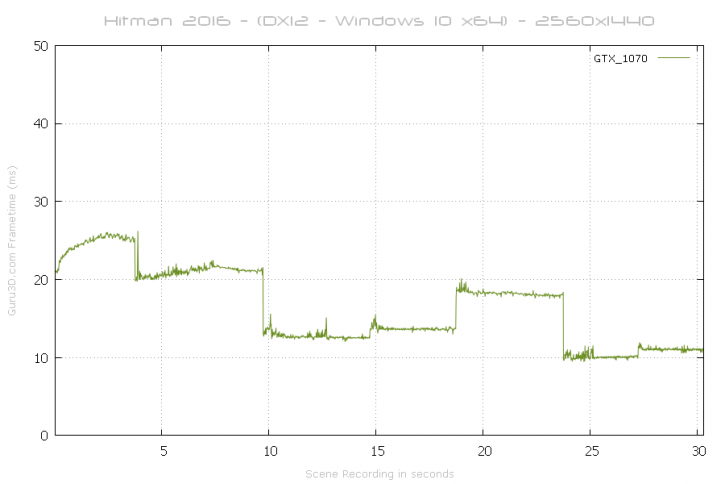
Once we move and plot the frame-time analysis, we cannot detect a significant glitch or stutter in frametime scaling (chart wise) that is extremely significant or long-lasting. Each square step above is a scene change indicating a higher/lower framerate
For those that do not understand what you are looking at, the above is a game-time scene recorded for 30 seconds. With this chart, lower = better. Huge spikes above 40 ms to 50 ms can be considered a problem like a stutter or indicate a low framerate. These are impressive results, BTW this is DirectX 12 enabled.
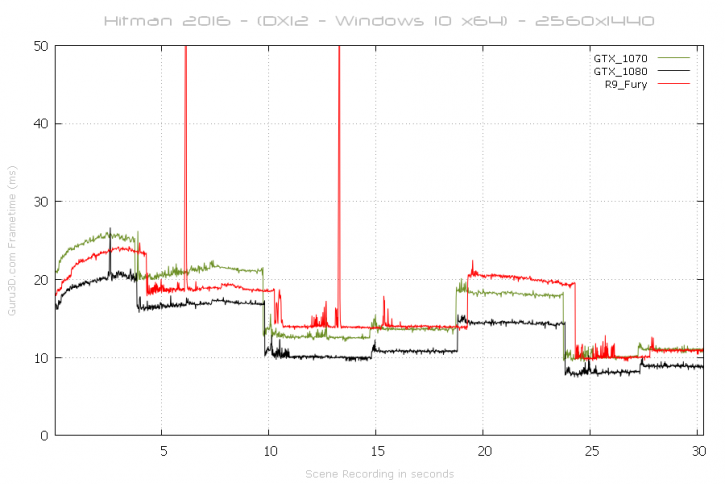
And combined, the GTX 1070 / 1080 and the R9 Fury from AMD in the 31 seconds run. The cards perform excellently really, albeit we did see two stutters with the Fury, which you can clearly see in the plot. Hitman is continuously loading stuff in the background though, even during the benchmark run.
