Testing Regimen
Testing Regimen
Right Mark Audio Analyzer
A DAC unit has no analog inputs so we will use a high end recording card to measure the output quality of this unit. When testing outputs using a loop into another interface, all distortion measurements are the combined values of both the output section and the recording sections.
Frequency ResponseThis graph shows the output signal characteristics of the Beresford TC-7520. The more linear the graphed response is the more transparent and neutral the cards outputs will be. Variances in the graph would produce coloration in that particular frequency range producing output higher or lower than the remaining frequencies. The TC-7520 produced excellent frequency response results.
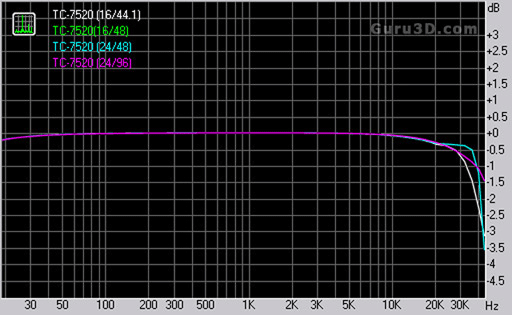
Notes on above Graph: We have noticed that RMAA has difficulty with scaling on the frequency axis when graphing multiple bit/depths and sample rates. The results are accurate when viewed on their own but the axis scaling is incorrect when comparing one to the others. We have contacted the RMAA authors in hopes they can shed some light on this and possible resolve the issue.
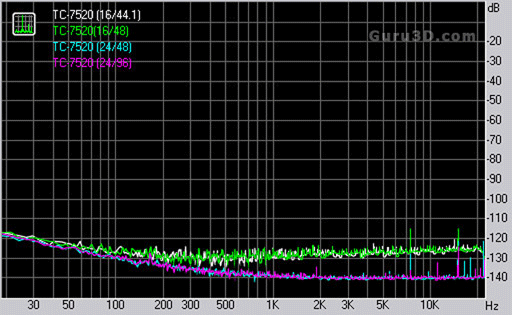
Noise Level
The above graph shows the level of noise present in the cards output signal. There will always be some level of noise present in any audio device but in many cases the level is so low that it is not audible to the human ear. The Beresford TC-7520 produced excellent noise measurements across the tested ranges.
Dynamic Range
This graph shows the card's operating range and the graphs illustrate the lowest and highest range the card is capable of producing accurately. Beresford TC-7520 shows an excellent dynamic range across the tested ranges.
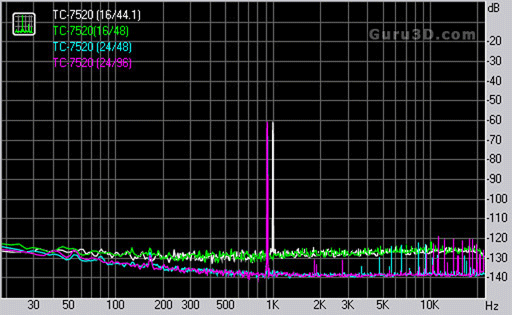
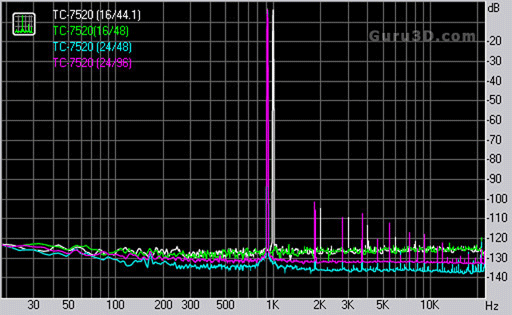
THD + Noise (at -3 dB FS)
The above measurements illustrates how much Total Harmonic Distortion and Noise is present in the cards output signal. Harmonic distortion presents itself as multiple odd and/or even harmonic overtones in the original signal. Lower measurements are preferred and the Beresford TC-7520 produced excellent THD+N measurements across the test set.
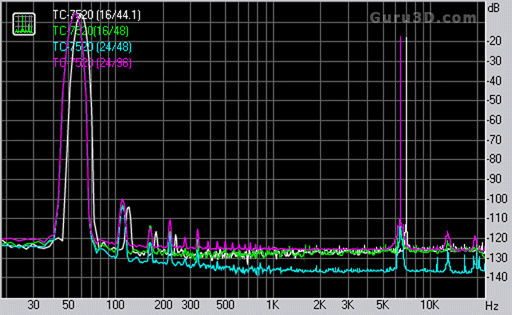
Intermodulation Distortion
This type of distortion results from multiple signals being mixed together and producing distortion in the form of overtones that are not harmonically linked to any of the base signals. Lower values are preferred for any type of distortion tests and the Beresford TC-7520 produced excellent results through the test sets.
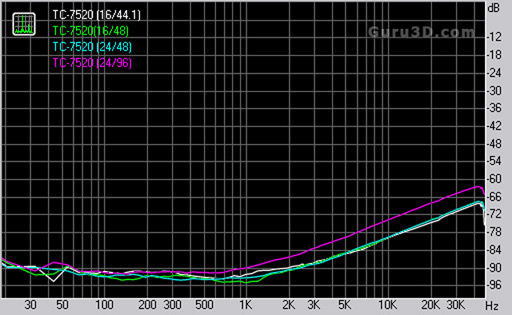
Stereo Crosstalk
This graph is a measurement of the bleed-through effect from one stereo channel to the other. The lower the measured crosstalk values are the less bleed through. In our test set the Beresford TC-7520 produced excellent results.