Catalyst 13.8 and FCAT Output Results
Catalyst 13.8 & FCAT Example Output Results
So I just took you through the more relevant hardware and software side of things. At the end of our articles you guys will be merely looking at a handful of charts and the big benefit of FCAT is that we can now present multiple datasets.
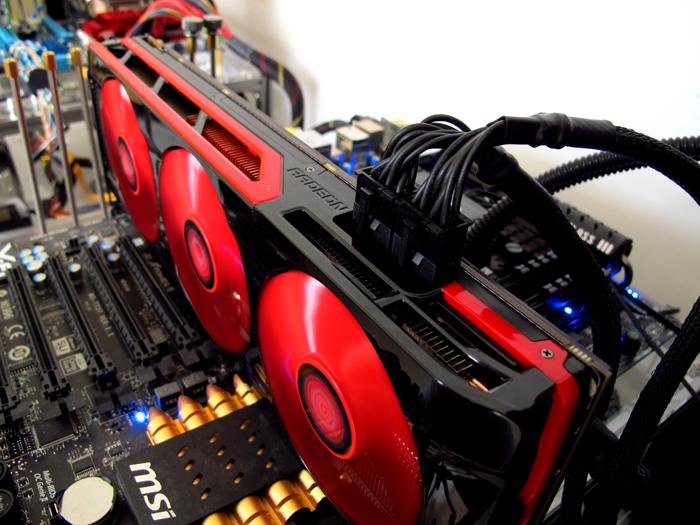
Now the focus today obviously is AMD. We'll be using their Radeon HD 7990 and on NVIDIA's side the GeForce GTX 690, both a dual-GPU of roughly the same caliber. But first let's so a little before and after shot for AMD:
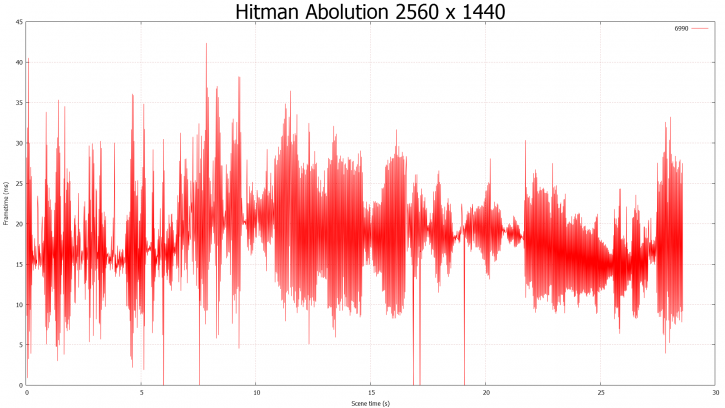
Catalyst 13.4 with two or more GPUs would show a LOT of microstuttering:
Now the same test run with Catalyst 13.8 Beta and framepacing activated:
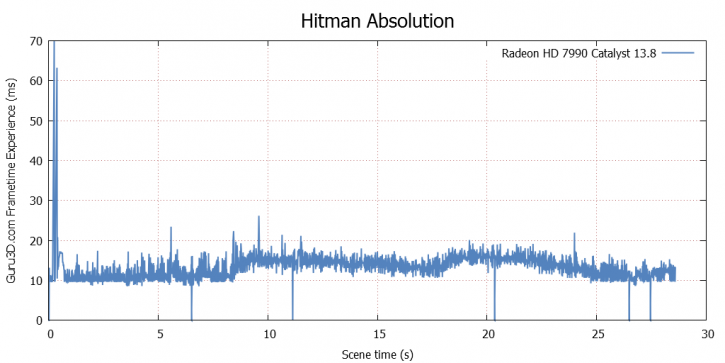
At the beginning the two spikes is the start of the scene, you can filter these out mentally as they are not relevant. Then the rest show a much more consistent frametime experience. This is actually very good. We do see 5 framedrops though (where the frame drops to 0ms. Other then that, nice results.
For those that do not understand what you are looking at, the above is a scene rendered. The plot is averaging 10ms to say 20ms per rendered frame. With this chart, lower = better. Huge spikes above 40-50ms can be considered a visible problem like a stutter, freeze or could indicate a low framerate due to a scene change, loading shaders etc.
So let's grab a GeForce GTX 690 and the Radeon HD 7990 and compare a little, next page please...
